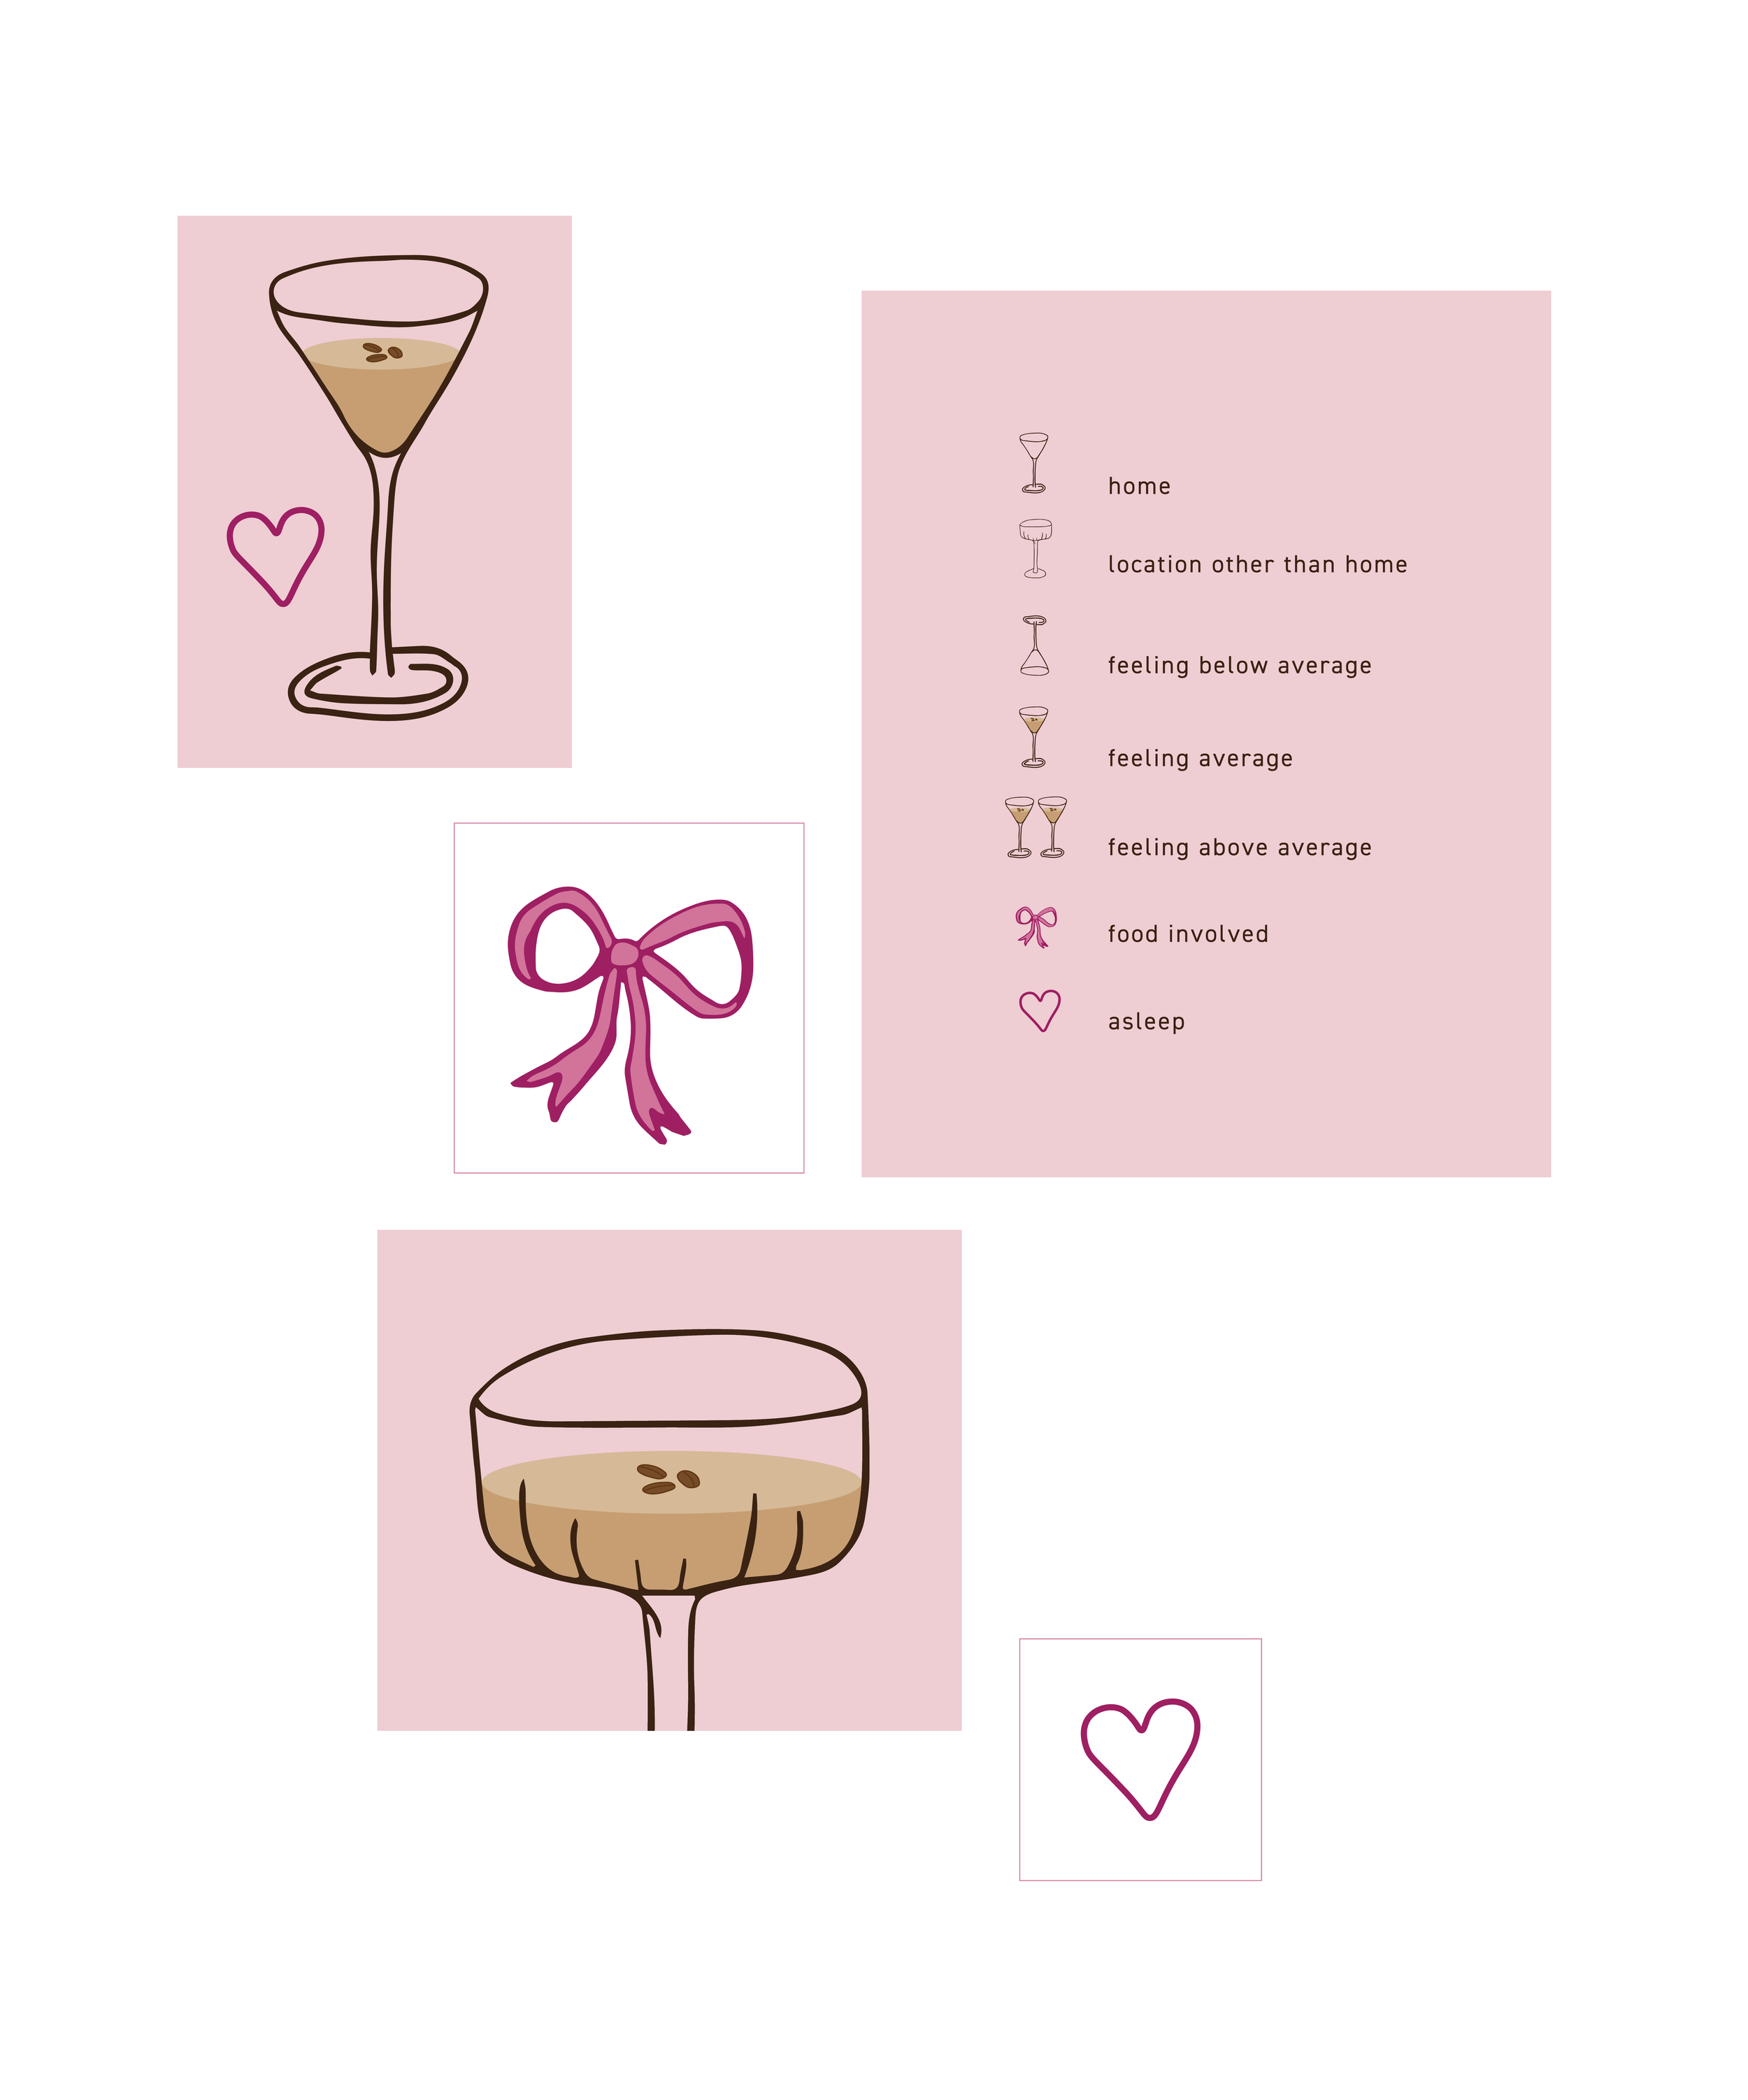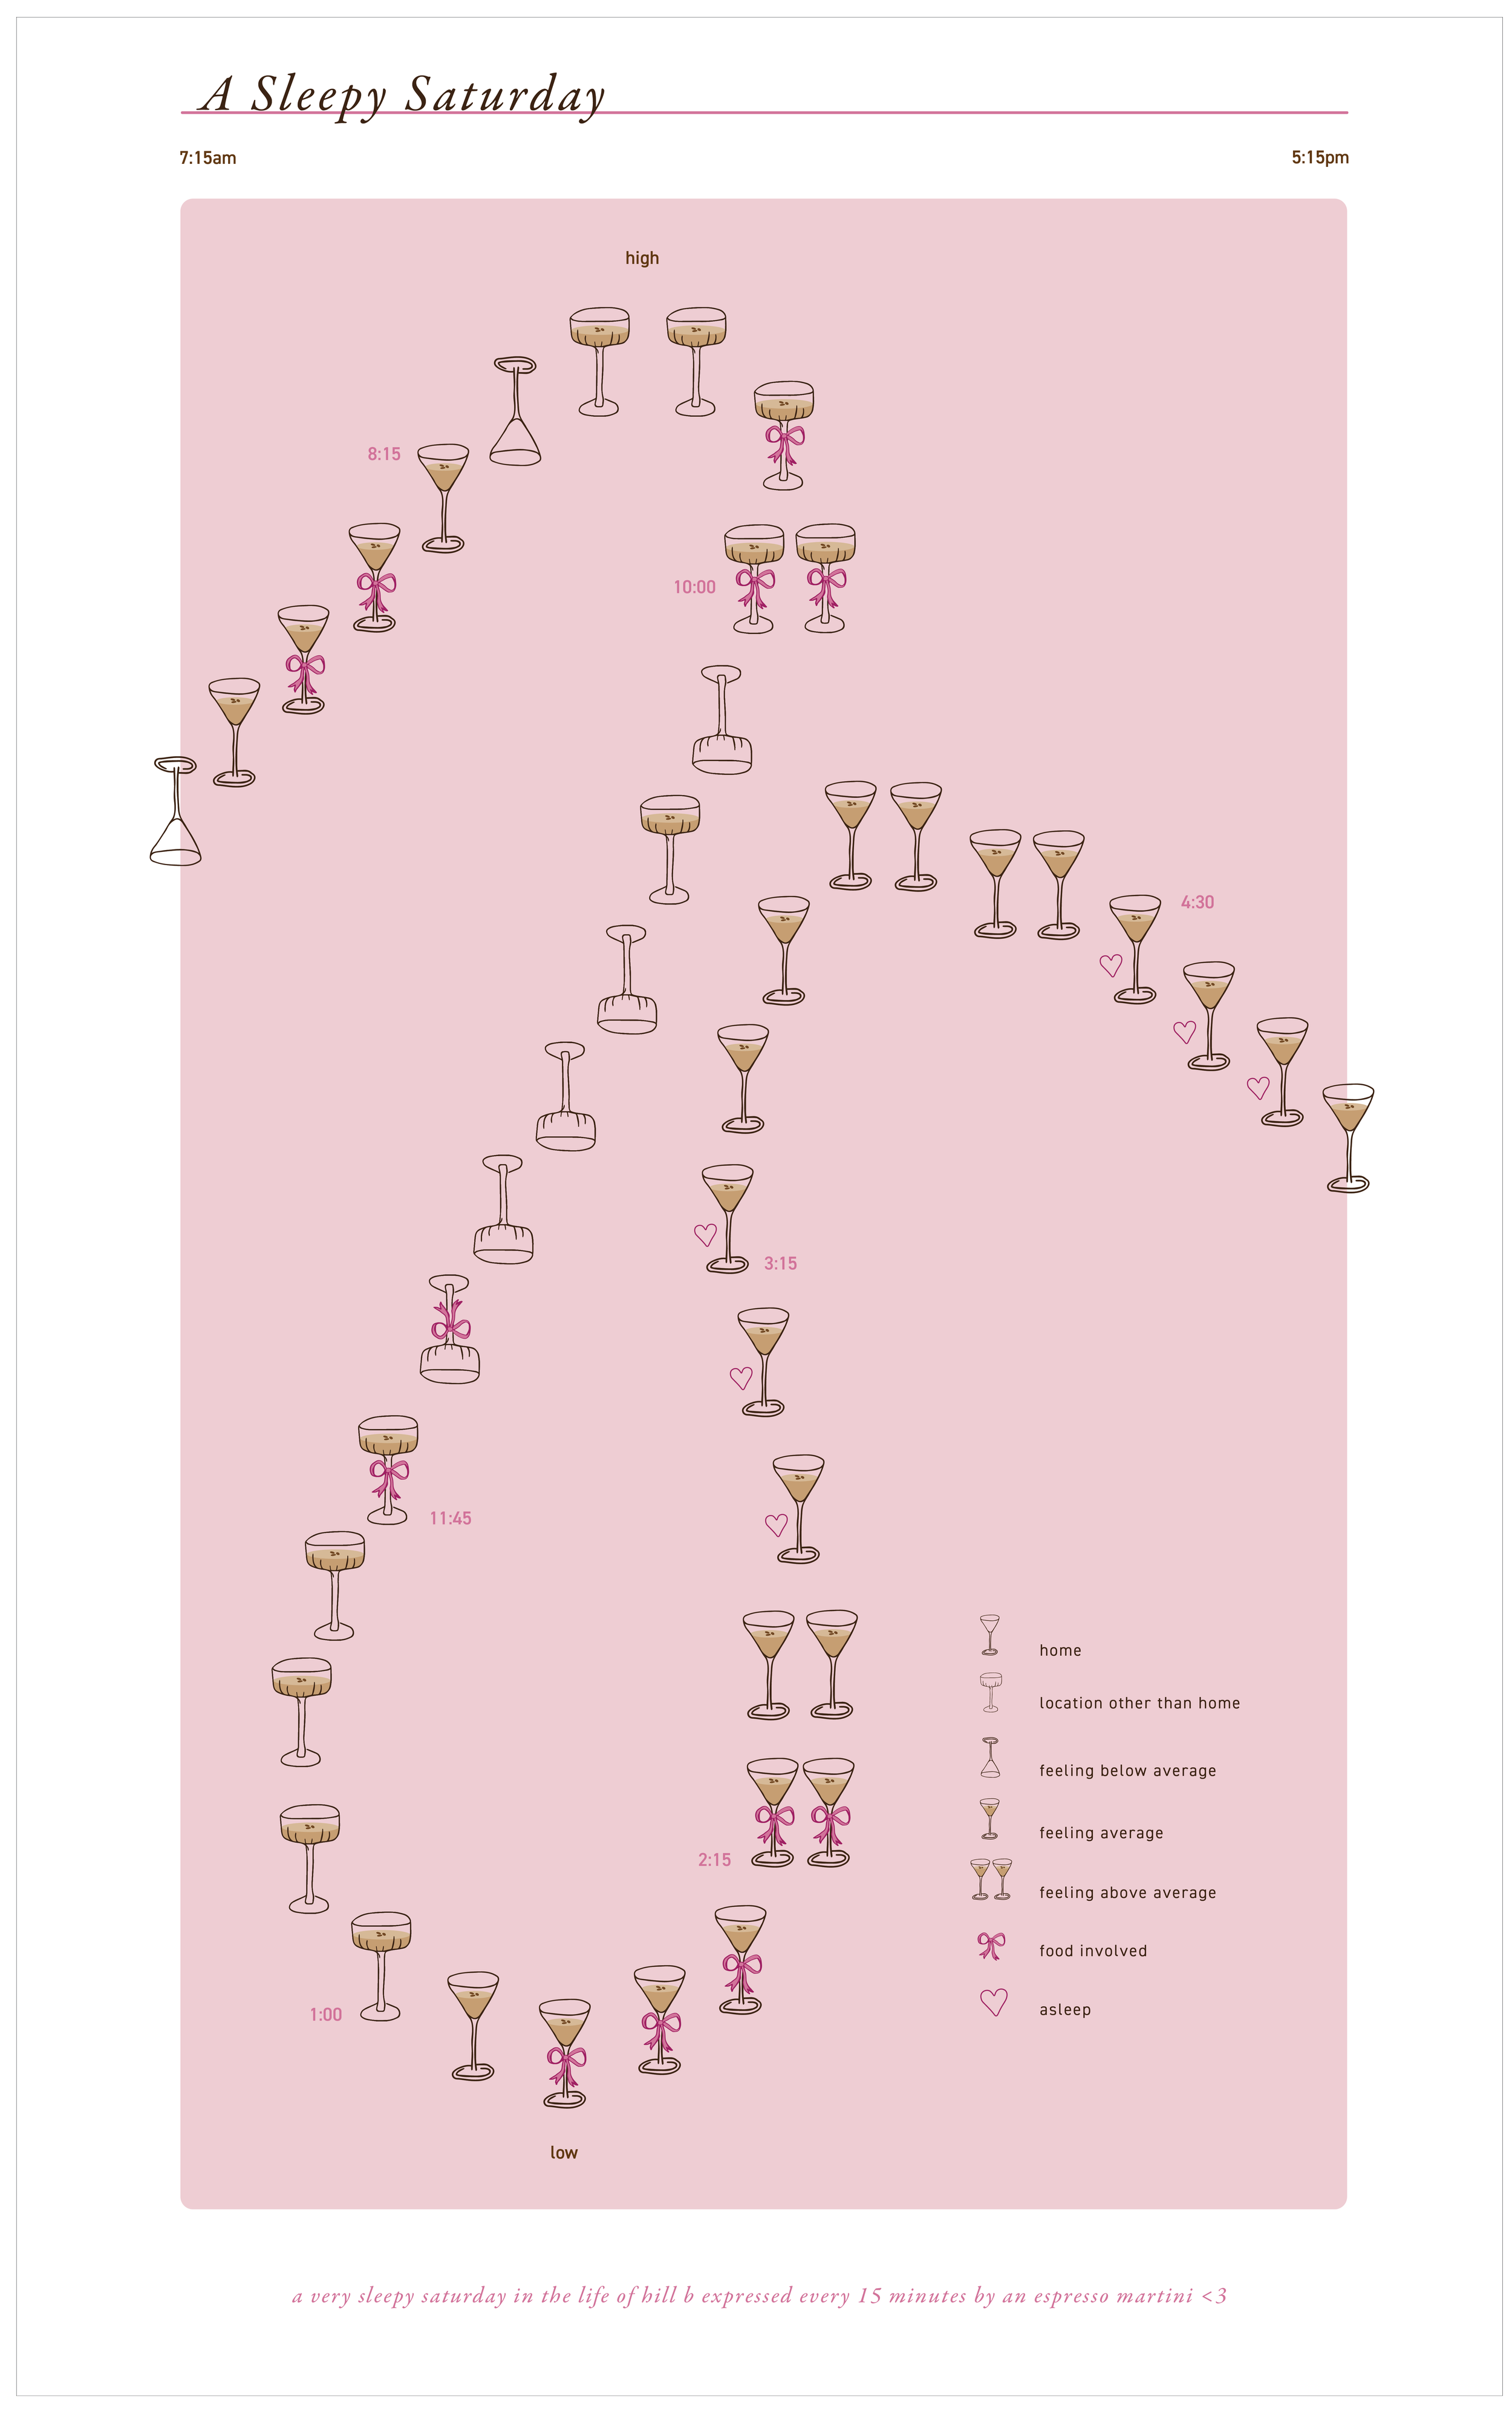
Data Visualization Poster
This is a timeline project that begin by recording what happened every 15 minutes of a day for 10 hours. I then took what happened in my day and assigned icons based on factors like how I was feeling and what I was doing. Each 15 represents a different espresso martini based on what was occurring.